Nearest neighbor: Nearest neighbor algorithms look for a solution to the following problem: In an X metric space, the S set of n data points is given and these points are processed in advance, and the closest data point to q of any query point q in any given X space can be reported quickly. This is also called the nearest point issue and the post office issue [1]. Finding the closest neighbor problem, image recognition, pattern finding, data mining, machine learning, data compression, statistics, etc. It is a problem frequently used in various applications.
This method is one of the effective classification algorithms in supervised learning methods. By calculating the normal behavior similarities in the learning set, the classification process is performed according to the threshold value formed by the mean of the closest “k” data. For the classification process here, first of all, the class properties must be determined. In addition, the number of “k” neighbors, similarity measurement, threshold value and adequacy of normal behaviors in the learning set are factors affecting the performance of this method [2].
Although it has a simple structure, distance-proximity determination can be costly, especially for large training sets. To avoid this, size reduction method can be applied in this algorithm or it can be used with more powerful data structures such as search trees [3].

he main distance measures. In the equations, x and y denote two different points. At the Minkowski distance, various distance measures can be defined for different values of q.
Naive bayes classifier: Naive Bayes is a probability classifier algorithm. In this algorithm, a probability set is created by counting the frequencies of the values in the data and their combinations [4]. The algorithm uses the mathematician Thomas Bayes’ theorem and assumes that all variables are independent given the value of the class variable.
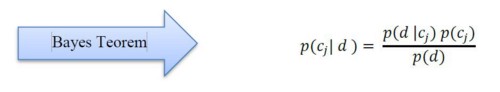
In the equation, 𝑑 denotes the known state and 𝑐𝑗 denotes different conditional states.
Decision trees: A classification tree is an experimental rule for predicting the class of an object from the values of predictor variables [6]. This name is given because it is a predictive model and progresses in tree structure. The branches and leaves of the tree are parts that contain the solution to the classification problem. Decision trees have the following features as advantages and disadvantages [7–8].
Algorithms developed to create a decision tree include the following [9–11]:
- CHAID (Chi- Squared Automatic Interaction Detector),
- C4.5,
- C5.0,
- CRT (Classification and Regression Trees),
- Exhaustive CHAID,
- ID3,
- MARS (Multivariate Adaptive Regression Splines),
- QUEST (Quick, Unbiased, Efficient Statistical Tree),
- SLIQ (Supervised Learning in Quest),
- SPRINT (Scalable Paralleizable Induction of Decision Trees)
Linear regression: Regression analysis is a statistical technique used to investigate and model the relationship between variables. [12]. In this technique, it is assumed that there is a relationship between the “Y” variable and the predictive variables “X1, X2,…, Xn” that are tried to be predicted. Linear regression analysis is divided into two as simple and multiple linear regression [13].
Simple and multiple linearity explain the relationship between the response variable and the explanatory variable. Simple regression can be used if there is only one explanatory variable in this relationship, and multiple regression analysis can be used if there is more than one explanatory variable [14–15]. The following equations are used for Simple and Multiple regression [16].
Support vector machines (SVM): It is an algorithm that can classify linear and nonlinear data, especially used for classification and regression [17–18]. SVM, which was introduced by Vapnik and Lerner in 1979, can be applied to training data in limited situations without error, while Cortes and Vapnik have been expanded by applying to non-separated training data in 1995 [19]. SVM focuses on finding the optimal separation hyperplane that classifies target data. It addresses the regression and classification problems using two typical variations, linear and nonlinear [20].
SVM is studied not according to the empirical risk minimization principle, but as structural risk minimization in statistical learning theory [21]. In Simple Regression Multiple Regression SVM, it is basically assumed that the samples in the training set are distributed independently and similarly [22].
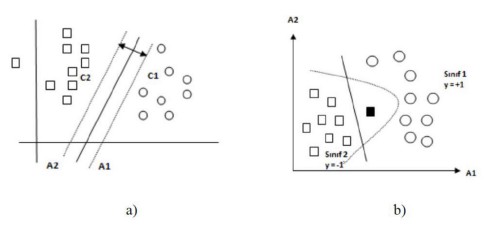
In the case of linear separation (a) the optimum separating extreme plane [21], the planes [24] in the case of data that cannot be separated linearly from each other (b) are as in the Figure.
Artificial neural networks: Artificial neural networks (ANN) are information processing structures inspired by the human brain, consisting of processing elements, each with its own memory, connected by connections of varying weights.

Artificial neural networks: Artificial neural networks (ANN) are information processing structures inspired by the human brain, consisting of processing elements, each with its own memory, connected by connections of varying weights.
As seen in the figure, ANN generates an output by using weights and activation function to the input given to it.
Neural cells come together in 3 layers as input layer, intermediate layers and output layer and in each layer in parallel and form the network. These layers [25]:
- Input layer: It is the layer where the processing elements are taken from outside and transferred to the intermediate layers, where information processing is not performed.
- Interlayer: These are the layers where the information from the input layer is processed and they can be more than one.
- Output layer: The information coming from the middle layer is processed and the output produced for the input is sent out.
Artificial neural networks have various advantages such as learning and generalization, data compatibility, parallel operation, nonlinearity, and fault tolerance. There are also usage examples in many application areas such as Engineering, medicine, finance, industry etc… [26].
Unsupervised learning models are in the next post …
REFERENCES
[1] Arya, S., Mount, D. M., Netanyahu, N. S., Silverman, R., and Wu, A. Y. (1998). An optimal algorithm for approximate nearest neighbor searching fixed dimensions. Journal of the ACM, 891–923.
[2] Kırmızıgül Çalışkan, S., ve Soğukpınar, İ. (2008). KxKNN: K-Means ve K En Yakın Komşu Yöntemleri İle Ağlarda Nüfuz Tespiti. EMO Yayınları, 120–124.
[3] Taşcı, E., ve Onan, A. (2016). K-En Yakın Komşu Algoritması Parametrelerinin Sınıflandırma Performansı Üzerine Etkisinin İncelenmesi, 102. Aydın: XVIII. Akademik Bilişim Konferansı — AB 2016.
[4] Patil, T. R., and Sherekar, S. S. (2013). Performance Analysis of Naive Bayes and J48 Classification Algorithm for Data Classification. International Journal Of Computer Science And Applications, 256–261.
[5] Saharkhiz, A. (2009). Naive Bayes Theorem. Web: https://www.codeproject.com/Articles/33722/Naive-Bayes-Theorem
[6] SPSS. (1999). AnswerTree Algorithm Summary. Web: https://s2.smu.edu/~mhd/8331f03/AT.pdf
[7] Pehlivan, G. (2006). Chaid analizi ve bir uygulama, Yüksek Lisans Tezi, Yıldız Teknik Üniversitesi Fen Bilimleri Enstitüsü, İstanbul.
[8] BÜ. (2019). Karar Ağacı (Decision Karar Ağacı (Decision tree) nedir? Başkent Üniversitesi, Web: http://mail.baskent.edu.tr/~20410964/DM_8.pdf
[9] Albayrak, A. S., ve Koltan Yılmaz, Ş. (2009). Veri Madenciliği: Karar Ağacı Algoritmaları ve İMKB Verileri Üzerine Bir Uygulama. Süleyman Demirel Üniversitesi İktisadi ve İdari Bilimler Fakültesi Dergisi, 14(1), 31–52.
[10] Emel, G. G., ve Taşkın, Ç. (2005). Veri Madenciliğinde Karar Ağaçları ve Bir Satış Analizi Uygulaması. Eskişehir Osmangazi Üniversitesi Sosyal Bilimler Dergisi, 6(2), 221- 239.
[11] Uzgören, N., Kara, H., ve Uzgören, E. (2005). Yöneticilerde Boyun Eğici Davranış Eğilimlerinin CHAID Analizi ile İncelenmesi: Yönetici Adayı Öğrenciler Üzerine Bir Araştırma. EKEV Akademi Dergisi, 19(61), 429–440.
[12] Montgomery, D. C., Elizabeth, A., Peck, G., and Vining, G. (2012). Introduction to Linear Regression Analysis. New Jersey, USA.: John Wiley & Sons Inc.
[13] Arı, A., ve Önder, H. (2013). Farklı Veri Yapılarında Kullanılabilecek Regresyon Yöntemleri. Anadolu Tarım Bilimleri Dergisi, 28(3), 168–174.
[14] Okur, S. (2009). Parametrik Ve Parametrik Olmayan Doğrusal Regresyon Analiz Yöntemlerinin Karşılaştırmalı Olarak İncelenmesi, Yüksek Lisans Tezi, Çukurova Üniversitesi Fen Bilimleri Enstitüsü, Adana.
[15] Weisberg, S. (2005). Applied Linear Regression. New Jersey: John Wiley & Sons Inc.
[16] Kutner, M. H., Nachtsheim, C. J., Neter, J., and Li, W. (2005). Applied Linear StatisticalModels. New York: McGraw-Hill Irwin Companies Inc.
[17] Çomak, E., Arslan, A., ve Türkoğlu, İ. (2007). A decision support system based on support vector machines for diagnosis of the heart valve diseases. Computers in Biology and Medicine, 37(1), 21–27. doi: 10.1016/j.compbiomed.2005.11.002
[18] Santhanam, T., and Padmavathi, M. S. (2015). Application of K-Means and Genetic Algorithms for Dimension Reduction by Integrating SVM for Diabetes Diagnosis. Procedia Computer Science, 47, 76–83. doi: 10.1016/j.procs.2015.03.185
[19] Cortes, C., and Vapnik, V. (1995). Support-Vector Networks. Machine Learning, 20(3), 273–297. doi: 10.1023/A:1022627411411
[20] Calp, M. H. (2018). Medical Diagnosis with a Novel SVM-CoDOA Based HybridApproach. BRAIN — Broad Research in Artificial Intelligence and Neuroscience, 9(4), 6–16.
[21] Yakut, E., Elmas, B., ve Yavuz, S. (2014). Yapay Sinir Ağları ve Destek Vektör Makineleri Yöntemleriyle Borsa Endeksi Tahmini. Süleyman Demirel Üniversitesi İktisadi ve İdari Bilimler Fakültesi Dergisi, 19(1), 139–157.
[22] Song, Q., Hu, W., and Xie, W. (2002). Robust Support Vector Machine with Bullet Hole Image Classification. IEEE Transactions on Systems, Man, And Cybernetics — Part C: Applications And Reviews, 32(4), 440–448.
[23] Çankaya, Ş. F., Çankaya, İ. A., Yiğit, T., ve Koyun, A. (2018). Diabetes Diagnosis System Based on Support Vector Machines Trained by Vortex Optimization Algorithm. Nature-Inspired Intelligent Techniques for Solving Biomedical Engineering Problems, 203–218. doi: 10.4018/978–1–5225–4769–3.ch009
[24] Özkan, Y. (2008). Veri Madenciliği Yöntemleri. İstanbul: Papatya Yayınları.
[25] Öztemel, E. (2003). Yapay Sinir Ağları. İstanbul: Papatya Yayınları.
[26] Arı, A., ve Berberler, M. (2017). Yapay Sinir Ağları ile Tahmin ve Sınıflandırma Problemlerinin Çözümü İçin Arayüz Tasarımı. Acta Infologica, 1(2), 55–73.
[27] Savaş, S. (2019), Karotis Arter Intima Media Kalınlığının Derin Öğrenme ile Sınıflandırılması, Gazi Üniversitesi Fen Bilimleri Enstitüsü Bilgisayar Mühendisliği Ana Bilim Dalı, Doktora Tezi, Ankara.
Hiç yorum yok:
Yorum Gönder